The cryptocurrency market reaches the end of the week with widespread declines in the crypto market. The week has been dominated by a boiling Altcoin segment that has set very significant rises.
The Bitcoin dominance chart was plummeting in the early hours of yesterday and picking up speed, threatening to move quickly to level 60. But when it started to turn around, the party was over on the rest of the board.
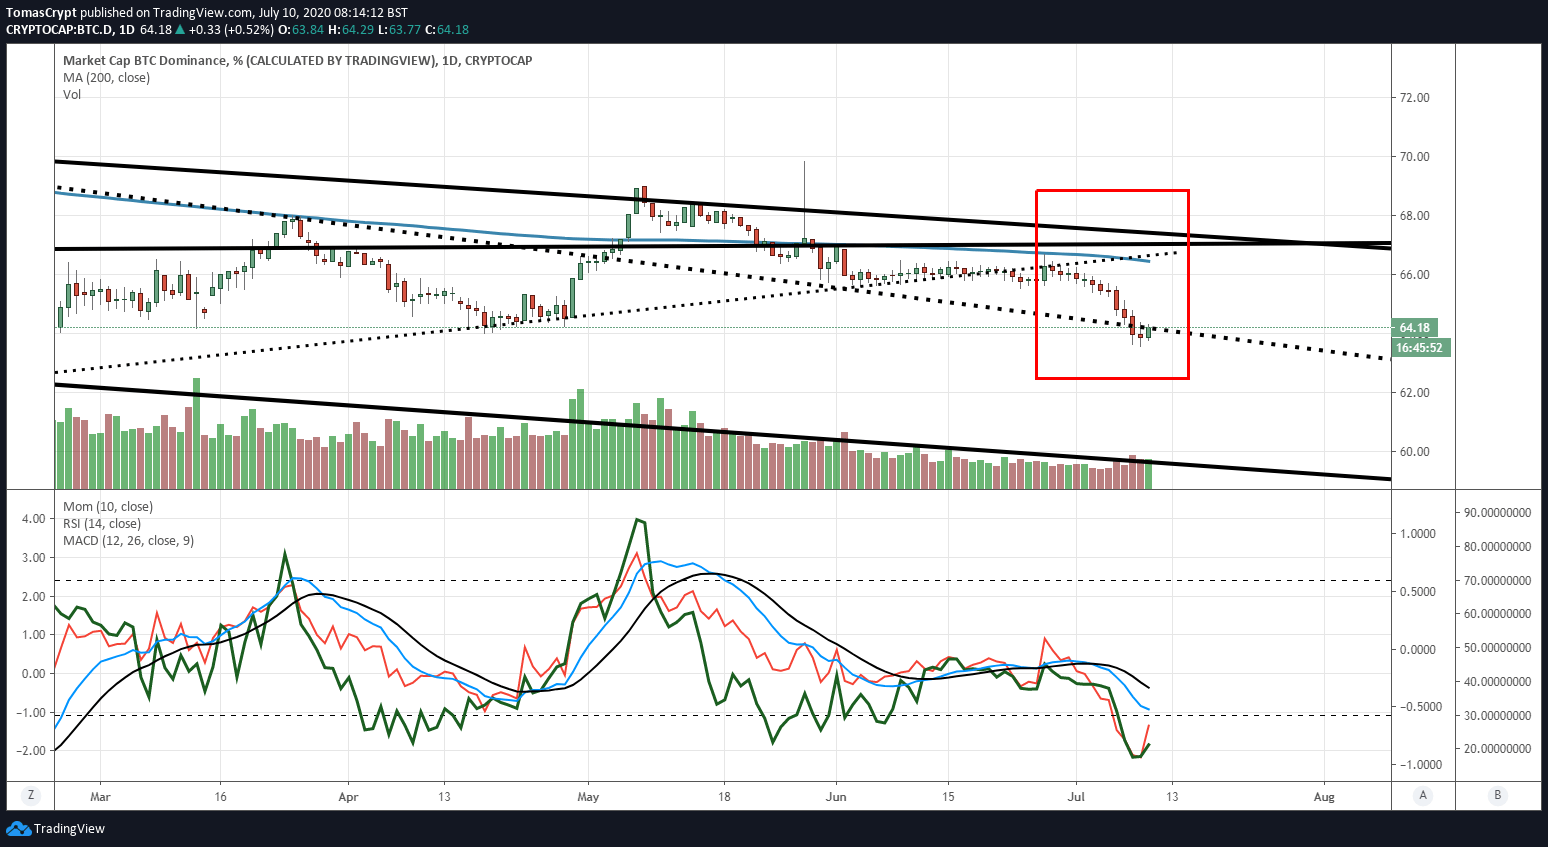
Sales in the Altcoin segment accelerated and ended up infecting the two market leaders.
Now at the start of the European session, Bitcoin is trying to overcome the dominance level of 64.15, causing the smaller cryptos to slow down because the environment is no longer favorable for them. Today’s close will determine the development of the next weeks.

Ethereum shows a lot of strength and remains above the critical support level that goes through the 10% dominance level. The technical indicators in the Ethereum dominance chart keep the bullish pattern active, so the short term outlook remains favorable in the short term.
ETH/BTC Daily Chart
The ETH/BTC pair is currently trading at the price level of 0.02599 and imperfectly draws on the chart a classic return figure in Japanese candlestick reading. A close below 0.026 would lead to a loss of momentum for the ETH/BTC, tending to consolidation rather than significant declines.
Above the current price, the first resistance level is at 0.0276, then the second at 0.0295 and the third one at 0.0307.
Below the current price, the first support level is at 0.026, then the second at 0.0248 and the third one at 0.0235.
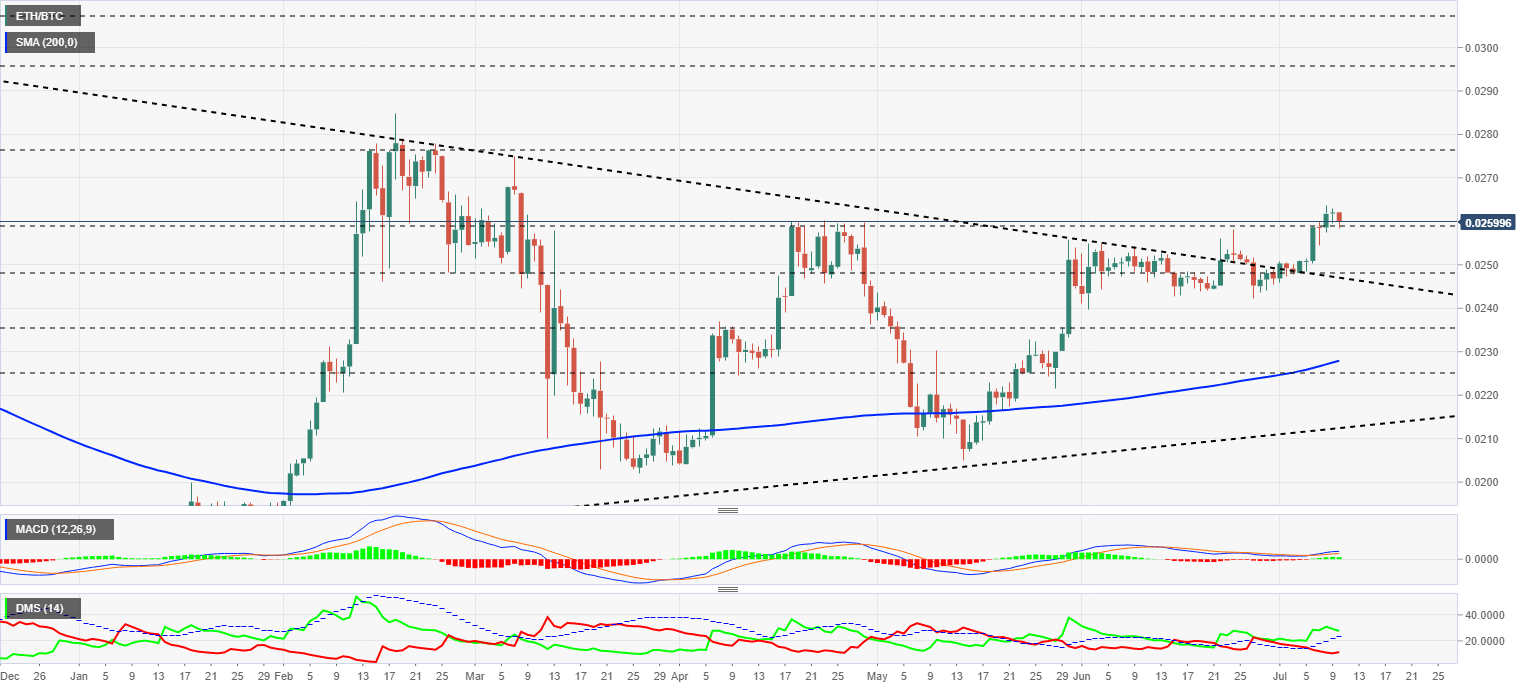
The MACD on the daily chart is losing its already weak bullish profile and is approaching a horizontal position that would confirm the loss of momentum.
The DMI on the daily chart shows the bulls controlling the ETH/BTC pair, although they are also losing momentum and appear to be looking for support at the ADX line. The bears are moving upwards and confirm the quick reaction of the sell-side.
BTC/USD Daily Chart
The BTC/USD pair is currently trading at the price level of $9172 and is moving towards the current scenario support level of $8900. Resistance at $9500 has been impossible to overcome and becomes the main challenge for the BTC/USD pair.
Above the current price, the first resistance level is at $9500, then the second at $10425 and the third one at $10700.
Below the current price, the first support level is at $8900, then the second at $8750 and the third one at $8450.
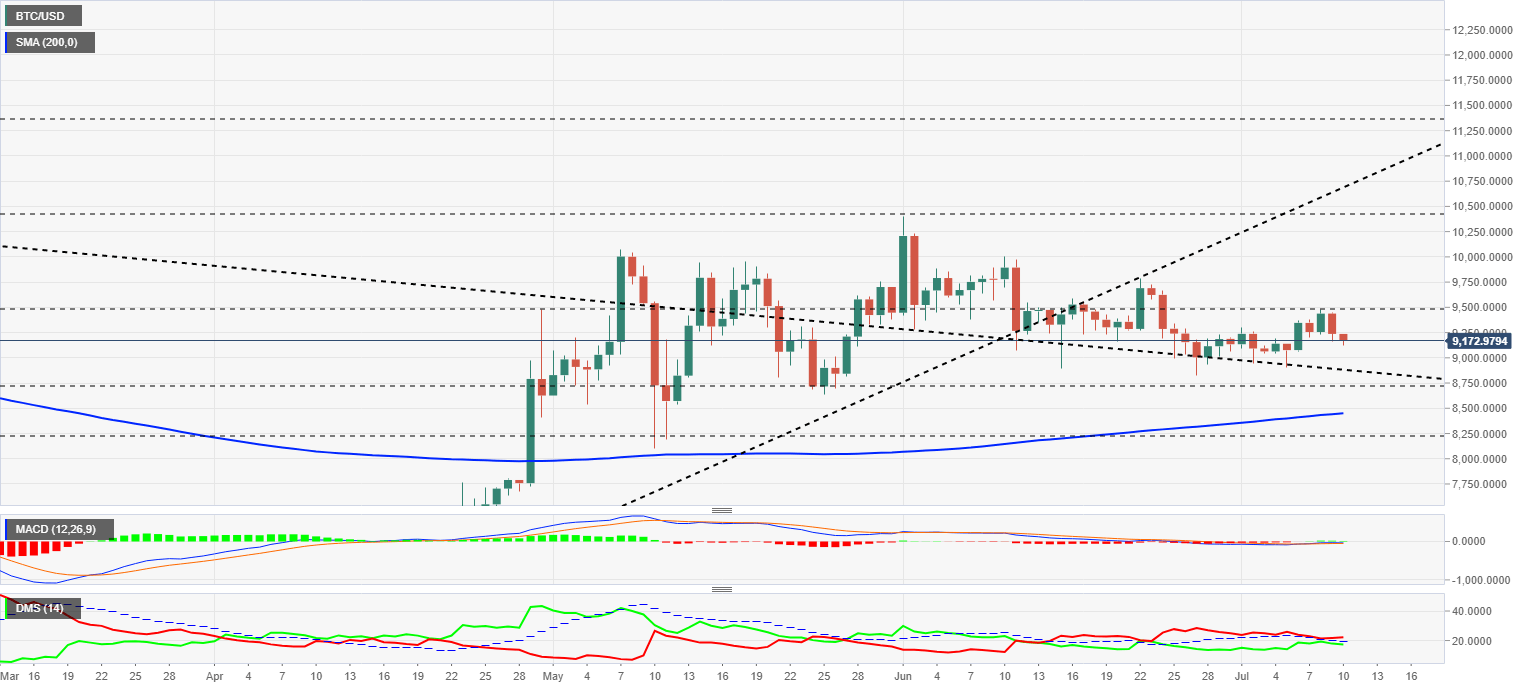
The MACD on the daily chart maintains one more day the horizontal and directionless profile of the last weeks. Despite the rise in the previous few days, the indicator is still in the negative territory.
The DMI on the daily chart shows bears leading the pair with a slight advantage over bulls. The presence of the ADX line above the bullish side positions limits the potential for the bulls to gain strength.
ETH/USD Daily Chart
The ETH/USD pair is currently trading at the $238.4 price level as it moves in search of support at the $235 level after failing to break above the $245 level.
Above the current price, the first resistance level is at $245, then the second at $260 and the third one at $270.
Below the current price, the first support level is at $235, then the second at $220 and the third one at $200.
